Utilisation surveys
Since 2013 we have run utilisation studies around the world, and built a reputation for delivering surveys well beyond what clients ask for, on a model that stays economical.
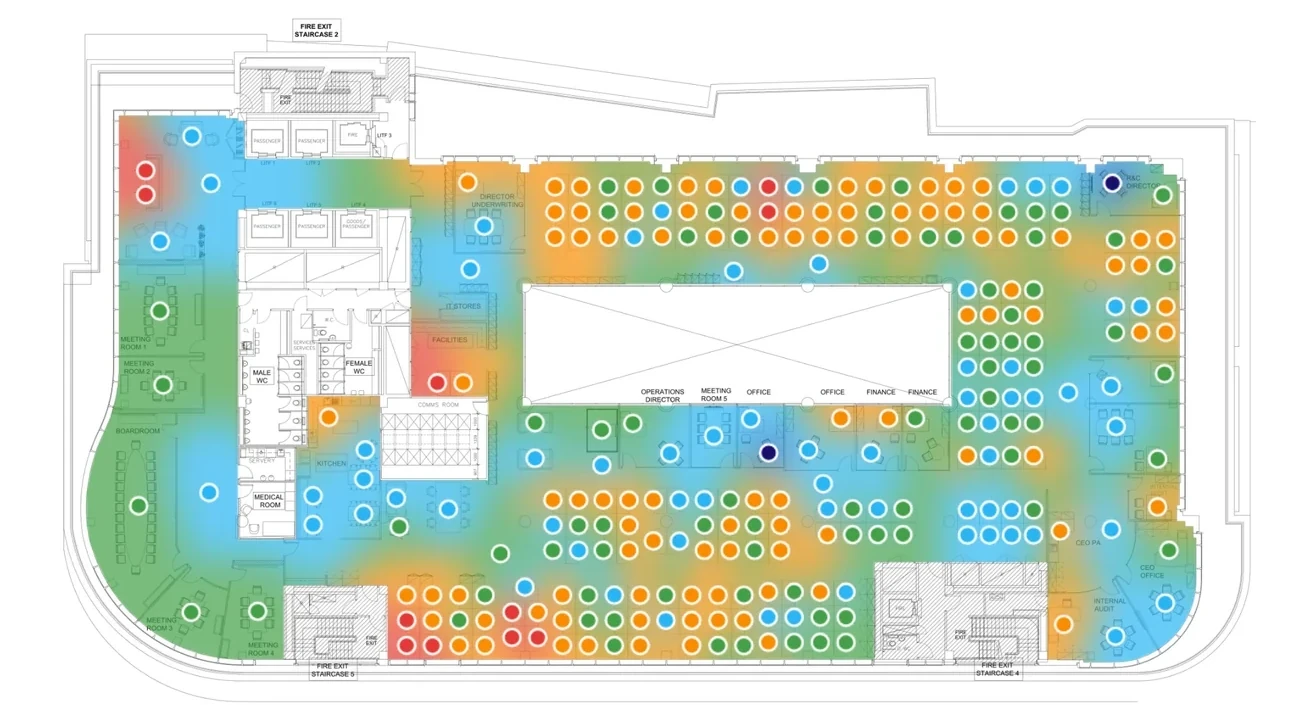
Live from our own database.
The platform
We did not buy the software that runs our studies. We built it, and we run every study on it. Your surveyors carry it on the floor and you log into the same thing: readings sync as they are taken, so the report is building while the survey is still running.
A finished study, every page, no login. Nothing is hidden behind a form.
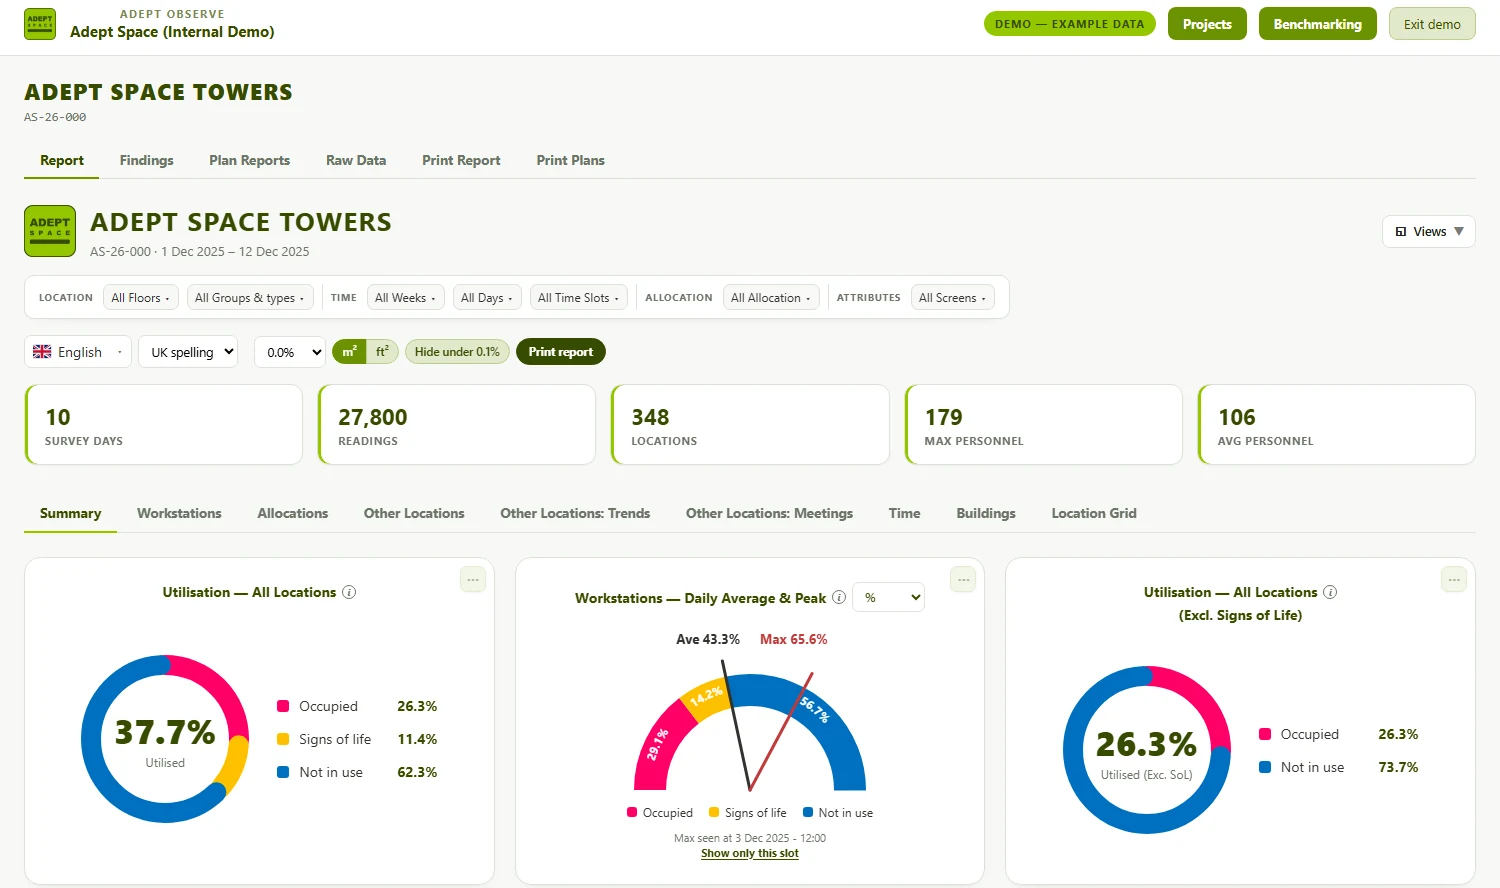
Readings reach the report from the floor as they are taken. You watch the picture build instead of waiting a fortnight for it.
Heatmaps drawn on your CAD, not a generic diagram, with utilisation by team, space type, day and hour.
Every study set against 605 others gathered the same way since 2013, filtered to your sector and region.
For consultants and service providers: our work, your name on the report and on the portal the client logs into.
Surveyors walk your floors with a tablet, several times a day, and record what every desk, meeting room and breakout space is doing: whether it is in use, by how many people, and the signs that it is held rather than used: a coat over a chair, a laptop left open, a room booked for twelve with two people in it.
More than six hundred studies on, we have turned an enormous amount of observation into decisions clients could act on: floors given up, desk ratios set, fit-outs briefed, space charged back to the business units actually using it.
No hardware goes in, nothing is installed on anybody's machine, and no individual is named or photographed. What gets recorded is a place and what was happening in it.
In a building you rent or share, an observed study is very often the only method open to you at all: no landlord consent, no badge data, nothing to take out afterwards.
Not a spreadsheet of readings. A document that answers the question you commissioned it to answer, with the evidence underneath it.
Every floor drawn from your own CAD, coloured by how hard each area actually works.
Peak and average, by team, space type, day and hour, plus the gap between how many desks are in use and how many people are in.
Space that is held rather than used: the coat, the laptop, the bag on the chair. Usually the difference between "we are full" and the truth.
What the numbers mean for your building, in sentences, not just charts.
Your building against hundreds of studies, filtered to your sector and region.
Every reading, exportable, so your own analysts can go further if they want to.
Plans in, every location drawn and named, survey days and times agreed, staff briefing sent.
Subject to access. Security clearance and induction can move this, and in some buildings it is the longest part of the job.
Set rounds, set routes, every location checked several times a day.
The length and the pattern are yours to set. Three or four weeks, one week a month, Tuesday to Thursday only, weekends, nights: whatever matches how the building is actually used.
Readings sync live. Log in mid-study and watch the pattern appear.
The full report, the benchmark comparison, and a conversation about what it means.
Anything we survey: a desk, a meeting room, a breakout seat, a phone booth, a quiet room. We agree the list with you during set-up, so there are no surprises in the report or the price.
Typically eight, one an hour across core hours, so the report shows a genuine profile of the day rather than one snapshot. Half hourly rounds are available where you want a finer picture, and the number is your call: the pattern is agreed before we start.
Yes, and it is usually where the value is: a portfolio read on one method, at one time, is the only way to compare buildings fairly.
Recorded from the doorway or through the glass where we can, and flagged where we genuinely cannot see in. The report says which, rather than guessing.
We can. Shift patterns, evening use and weekend working all change the answer, and we would rather measure them than average them away.
Across every study in the benchmark. Useful as a sense of scale, and as a warning against deciding anything from how the floor looks on the way to a meeting.
A study can arrive under your name, not ours. Consultants and service providers run ours as their own, with their branding on the report and on the portal their client logs into.
Evidence behind a design proposal, in your drawing standards.
Your report, your logo, your client relationship. We stay invisible.
Occupancy work across a managed portfolio, repeatable year on year.
An independent answer, commissioned by the occupier.
Get onto Adept Observe
Look at a finished study first, price one up yourself, or hand the whole thing to us. All three run on the same platform.
A real report, every page, no login and no form. The fastest way to know whether this is what you want.
Price a study by the number of locations, set it up and survey your own offices, start to finish.
Our surveyors, your building, the report and the benchmark at the end of it. Tell us the decision you are facing.
Tell us the building and the decision in front of you, and we will tell you what a study would take and what it would cost.
 Adept Space